
At a Glance
- Ground penetrating radar utility locating is one method within a broader subsurface utility investigation workflow. It excels at locating non-conductive utilities that electromagnetic induction cannot detect, including plastic gas lines and PVC conduit.
- GPR does not positively identify every utility in the ground on its own. Soil conditions, depth, utility material, and signal interference all affect data quality and require trained interpretation.
- The most accurate subsurface utility locating programs layer GPR with electromagnetic (EM) methods, vacuum excavation confirmation, and existing record review.
- Proper site preparation, antenna frequency selection, and grid pattern scanning meaningfully improve GPR data reliability.
- Quality Level B subsurface utility location work, which includes both EM and GPR, produces the type of documented output required for ASCE 38 design-level projects.
What Ground Penetrating Radar Utility Locating Actually Does
GPR maps subsurface anomalies based on material contrast. It detects what EM cannot, but it requires skilled interpretation and site-specific calibration to produce reliable data.
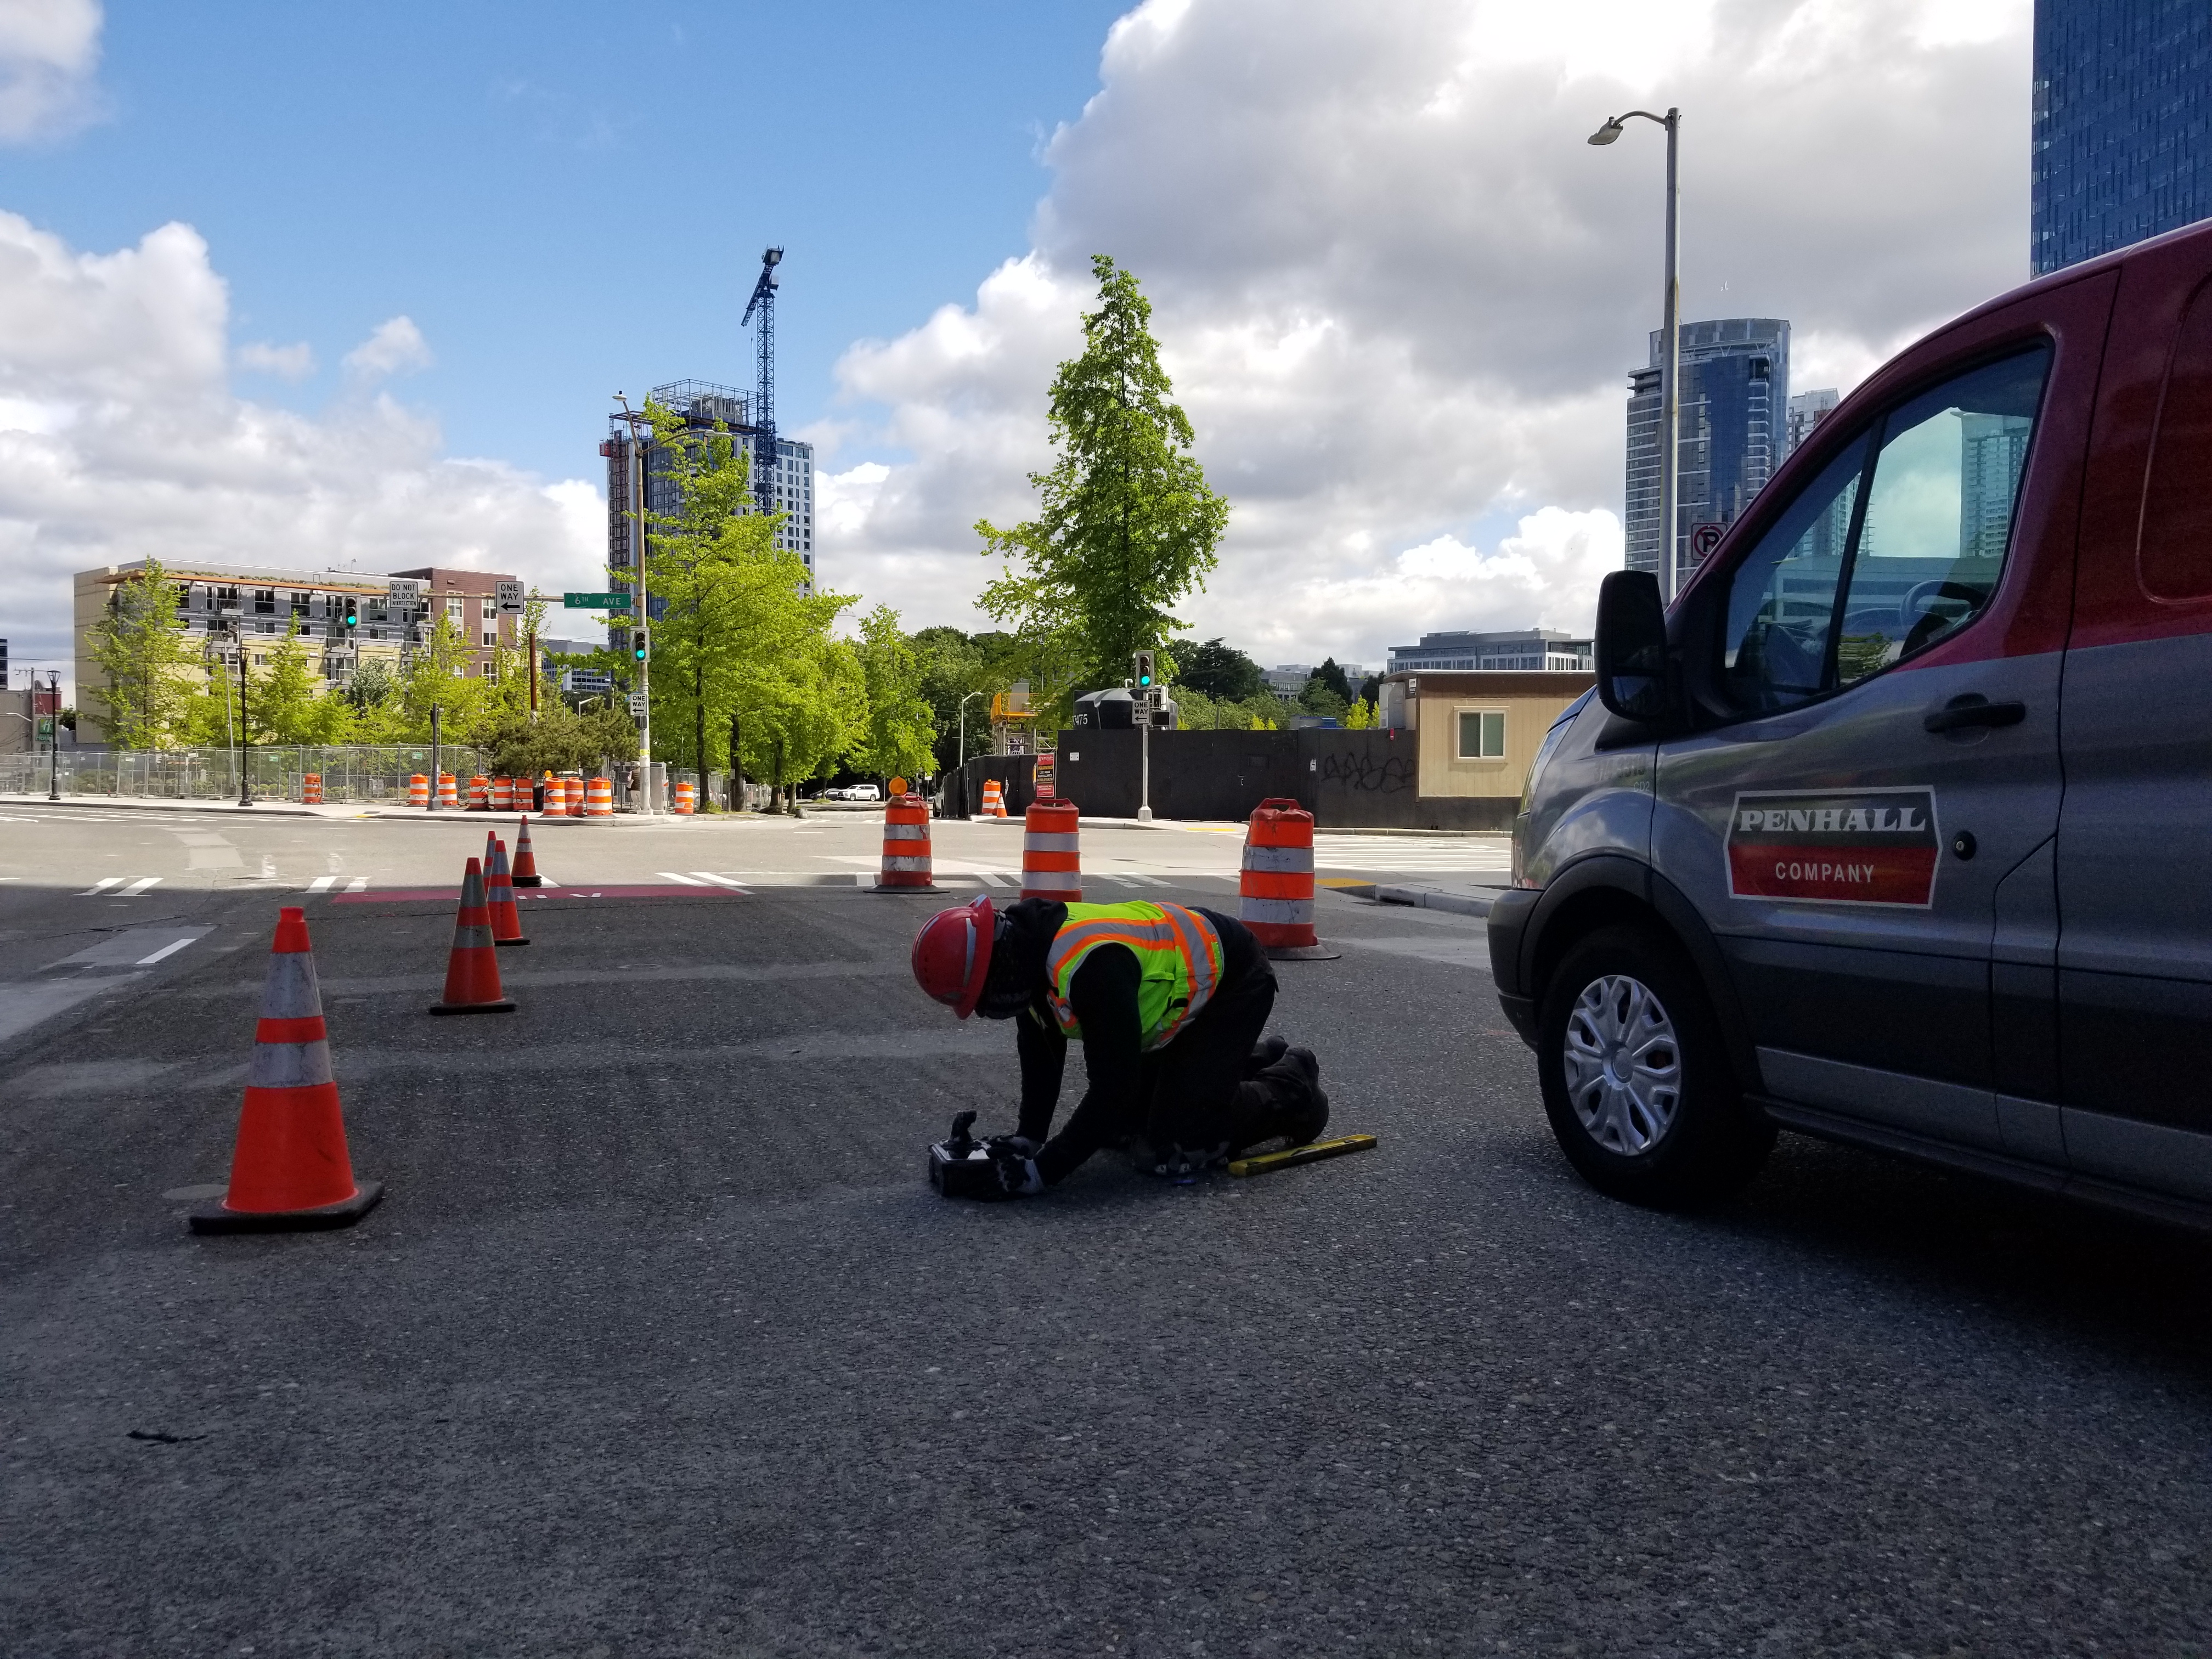
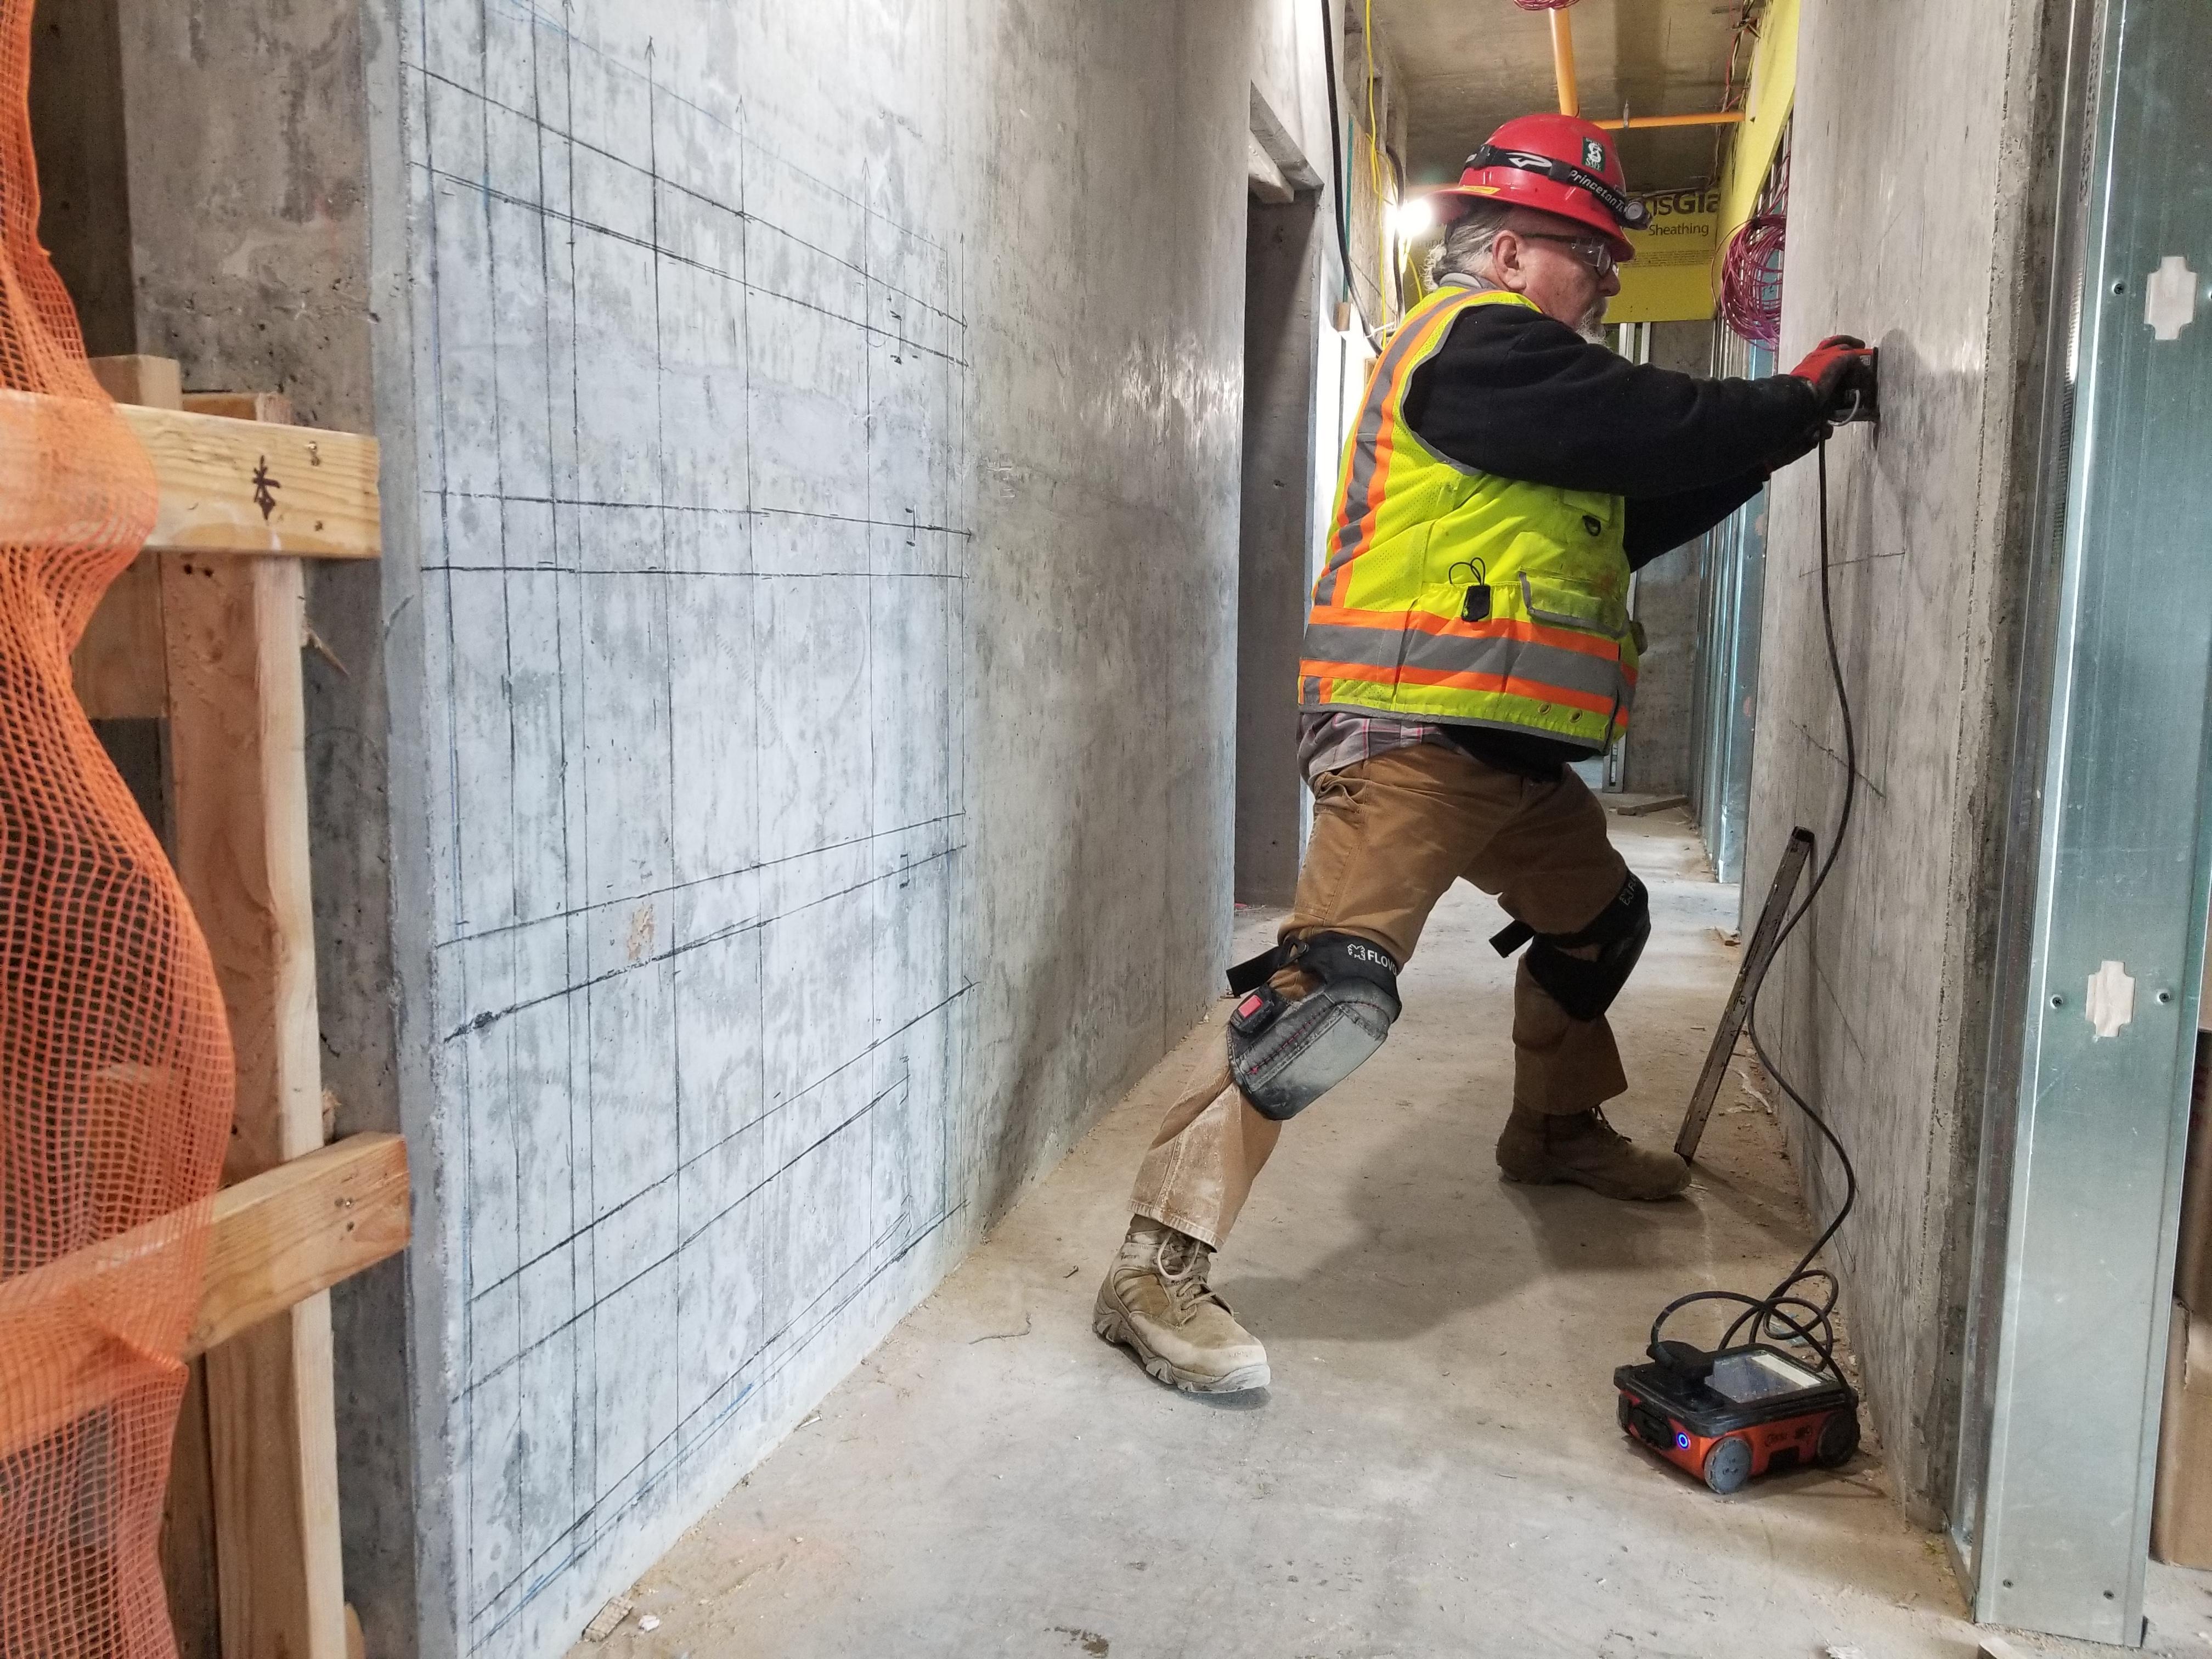
Ground penetrating radar utility locating works by transmitting radio wave energy pulses into the ground and recording the reflections that return when those waves encounter a change in material density. A buried pipe, conduit, or void creates a reflective boundary that appears on the GPR screen as a hyperbolic arc. A trained technician reads those arcs, accounts for signal velocity in the specific soil type present, and marks the approximate depth and horizontal position of the anomaly.
The fundamental output of a GPR scan is a two-dimensional cross-section of the subsurface called a radargram. On a radargram, depth is represented on the vertical axis and horizontal distance traveled is on the horizontal axis. Each hyperbolic shape represents a point-source reflection, typically a pipe, cable, or conduit crossing the scan line perpendicularly. The apex of that hyperbola marks the utility's location. Reading radargrams accurately takes field experience and cannot be automated reliably on complex or congested sites.
GPR is not a metal detector. It responds to dielectric contrast, meaning the difference in electrical properties between a buried object and the surrounding soil. This is why GPR can locate plastic water mains, PVC conduit, fiber optic ducts, and concrete-encased duct banks that electromagnetic induction misses entirely. Conversely, GPR can struggle to distinguish a steel pipe from a concrete foundation edge if both produce similar reflective signatures in the same scan line.
Where GPR Fits in a Subsurface Utility Investigation Workflow
Subsurface utility locating is not a single-method process. The American Society of Civil Engineers standard ASCE 38-22 defines four Quality Levels of subsurface utility information, ranging from D (records only) through A (vacuum excavation confirmation). GPR utility locating operates primarily at Quality Level B, alongside electromagnetic induction, as part of the field investigation that produces designatable utility data.
A standard workflow for a commercial or infrastructure site typically moves through these stages:
Stage 1: Records collection and conflict assessment. The crew gathers as-built drawings, 811 one-call markings, utility owner records, and any prior survey data. These records establish expected utility corridors and flag potential conflicts before field work begins.
Stage 2: Electromagnetic induction scanning. EM locating traces conductive utilities, including metallic water mains, gas lines, electrical conduit, and steel-jacketed telecommunications lines. EM is faster across large areas and produces a reliable signal on conductive targets with a good ground contact.
Stage 3: GPR scanning to fill detection gaps. Non-conductive utilities, abandoned lines not visible on records, and congested duct banks in close proximity often fall outside what EM detects reliably. GPR scanning runs in a grid pattern over the investigation area to capture these targets. It also provides independent depth confirmation on lines already located by EM.
Stage 4: Correlation and mapping. Field data from EM and GPR is correlated with the records from Stage 1. Anomalies that do not match any known utility are flagged for vacuum excavation confirmation before excavation proceeds.
Stage 5: Quality Level A confirmation where required. On high-consequence projects, vacuum excavation exposes selected utilities for physical measurement of depth, diameter, and material, converting Quality Level B data to Quality Level A.
Running GPR in isolation without EM correlation and records review is how misses happen. Each method covers detection gaps the others leave behind.
What GPR Utility Locating Can and Cannot Detect
Understanding GPR's detection envelope prevents both overconfidence in its results and unnecessary skepticism about its role.
GPR reliably detects:
- Plastic, PVC, and HDPE water and gas lines
- Concrete-encased duct banks and conduit systems
- Fiber optic and telecommunications ducts
- Steel, ductile iron, and copper metallic utilities (though EM is typically more efficient for these)
- Concrete structures, footings, and slabs below grade
- Voids, sinkholes, and subsidence zones
- Reinforcement steel (rebar) in concrete structures
GPR detection is reduced or unreliable when:
- Soils are high in clay content or moisture-saturated. Clay attenuates the GPR signal rapidly, often limiting penetration depth to 18 inches or less in severe conditions.
- Utilities run parallel to the scan line rather than perpendicular to it. Parallel targets do not produce the hyperbolic reflection needed for confident identification.
- Multiple utilities are closely spaced. Signal overlap between adjacent lines can obscure individual pipes in congested corridors.
- Conductive soil fills, road base material, or buried debris create high-amplitude background clutter that masks weaker reflections from smaller-diameter utilities.
- Depth exceeds the antenna's effective penetration range for the soil conditions present.
These limitations are not reasons to avoid GPR. They are inputs for planning scan frequency, antenna selection, and field confirmation strategy.
Antenna Frequency Selection and Its Effect on Results
GPR antenna frequency is the primary variable that controls the trade-off between penetration depth and resolution. Higher frequency antennas resolve smaller targets more clearly but attenuate faster in the ground. Lower frequency antennas penetrate deeper but cannot distinguish closely spaced targets or small-diameter utilities.
The most common antenna ranges used in underground utility locating services work are:
200 to 400 MHz antennas are standard for utility locating on most site types. They balance depth penetration (typically 8 to 15 feet in moderate soils) with enough resolution to identify pipes in the 4-inch diameter range and larger. Most municipal infrastructure and commercial utility corridors fall within this range.
500 to 900 MHz antennas resolve shallower targets with greater clarity. They are appropriate for congested shallow duct banks, shallow conduit, and sites where maximum depth is less important than distinguishing closely spaced utilities at 3 to 6 feet of depth.
100 MHz and below are used when deep penetration is required, such as geological investigation, deep foundation work, or void detection below 20 feet. Resolution at these frequencies is insufficient for standard utility line differentiation.
On sites with variable soil conditions or uncertain utility depth, crews may run dual-frequency passes to capture both shallow and deep targets in a single investigation. Antenna selection should be part of the pre-job planning conversation, not a default choice made in the field.
How to Set Up a Job Site for Reliable GPR Results
Site preparation is where GPR data quality is won or lost before the antenna touches the ground. Several field conditions are within the project team's control and directly affect signal quality.
Surface condition. GPR antennas must maintain contact with the surface. Broken pavement, standing water, thick gravel beds, and heavy debris scatter the signal before it enters the ground. Surface preparation, including clearing loose material from scan lanes, measurably improves data coherence.
Scan line grid planning. Utilities run in multiple orientations across a site. Scanning in a single direction only captures utilities oriented perpendicular to that pass. A complete investigation covers orthogonal scan lines, typically in both X and Y directions at a maximum of 18-inch spacing for comprehensive coverage, tighter on congested sites. Mark scan lines before field work begins so coverage is documented.
Interference identification. Metal objects at or near the surface, overhead utilities directly above the scan corridor, and vehicles parked adjacent to the scan area all introduce noise. Identifying and removing or documenting these interference sources before scanning prevents false positives and ambiguous data interpretation.
Calibration passes. On sites where known utility depths exist from records or previous vacuum excavation, a calibration pass over a known target allows the technician to determine the actual signal velocity in the site's specific soil matrix. Calibrated velocity produces more accurate depth estimates across the rest of the site.
Pre-scan EM work first. Complete electromagnetic induction passes before GPR whenever possible. EM results allow the GPR crew to cross-reference expected utility locations and orient their scan lines for maximum perpendicular intercept with target utilities.
GPR Data Output and Documentation Standards
GPR utility locating produces deliverables that should be documented, not just verbally communicated. On projects governed by ASCE 38-22, Quality Level B data must be recorded in a format that supports plan incorporation.
Standard GPR documentation outputs include:
Radargram files. Raw data files from the GPR control unit, stored in the equipment manufacturer's format and archived for re-processing or review if questions arise post-investigation.
Interpreted utility maps. Field-marked surface positions transferred to a site base map, annotated with estimated depth, utility type where identified, confidence rating, and anomaly flags for targets requiring confirmation.
Scan coverage diagrams. A record of scan line locations and directions, confirming that the investigation area was systematically covered. This is the basis for demonstrating that negative results (no utility found in a given area) reflect actual coverage, not missed scans.
Field notes. Documentation of soil conditions, surface preparation status, antenna frequencies used, calibration data, interference sources, and any conditions that may have limited signal quality in specific zones.
Quality Level B deliverables are the standard for projects where designers need subsurface utility information before finalizing plans. Providing raw field marks without documented backup leaves the project team without the chain of evidence needed to defend excavation decisions if a utility conflict occurs.
How Penhall Approaches Underground Utility Locating Services
Penhall's underground utility locating services combine GPR utility locating, electromagnetic induction, and vacuum excavation into a coordinated workflow managed by experienced field crews. The process is calibrated to each site's soil conditions, utility complexity, and project Quality Level requirements before the first scan pass begins.
Penhall's field technicians document GPR results in a format that supports plan-level deliverables, conflict mapping, and vacuum excavation follow-up on anomalies that require physical confirmation. For projects with tight excavation schedules or congested utility corridors, coordinating the subsurface utility locating scope early, before design is finalized or excavation permits are pulled, reduces the risk of field-discovered conflicts that delay work.
To discuss a subsurface utility locating scope for an upcoming project, contact Penhall directly.